SGE Viewer – User Manual
www.sge-ing.de – Version 1.62.67 (2022-07-24 22:21)
1 Introduction
The SGE Viewer is used in three different modes:
SGE figure visualization
The results of measurement analysis and calibration are prepared by SGE Ingenieur GmbH as special figure files, which can be loaded with the SGE Viewer. These figures provide special features then. This is the main use mode and this documentation gives you further information regarding this mode.
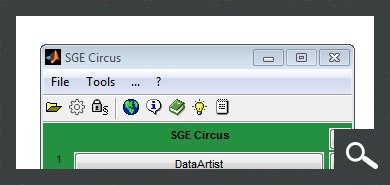
Session reopening
The DataArtist and MapArtist provide the functionality to save the session to file at any time. These session files can be reopened with the SGE Viewer and full functionality is available again immediately.
MATLAB (*) figure file viewer
The SGE Viewer can be used to open any MATLAB figure. But the special functionality like data items switching in SGE figure visualization mode will not be available.
The SGE Viewer is developed in MATLAB and is utilized compiled. It is available license free and executable without MATLAB after installation of the freely available MATLAB Compiler Runtime (MCR). This manual contains information concerning specifically the SGE Viewer only. The SGE Viewer is part of the SGE Circus. For help topics regarding general features please refer to the corresponding documentation accessible using the links below.
1.1 SGE Circus user manualThe SGE Circus documentation makes available general information regarding data loading procedure, input handling, preferences, history and other topics concerning all tools. |
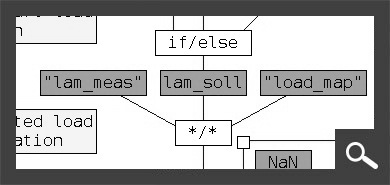
1.2 SGE CalcGuide user manualThe SGE CalcGuide is a tool to implement calculation routines by creating graphical flow chart diagrams - included with all tools. |
|
|
|
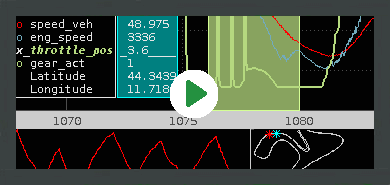
1.3 SGE Circus videos (external) |
|
|
|
For information regarding the version dependent software changes please refer to the Release notes accessible using the corresponding menu item inside the SGE Circus.
2 Keyboard shortcuts, mouse gestures
Many functions are quickly accessible via keyboard shortcuts. For a list of available keyboard shortcuts, see the list below. In addition, the entries in the menus and context menus as well as the tooltips of the toolbar point to shortcuts.
3 SGE figure visualization
The SGE viewer provides some special functionality when used to open SGE figures.
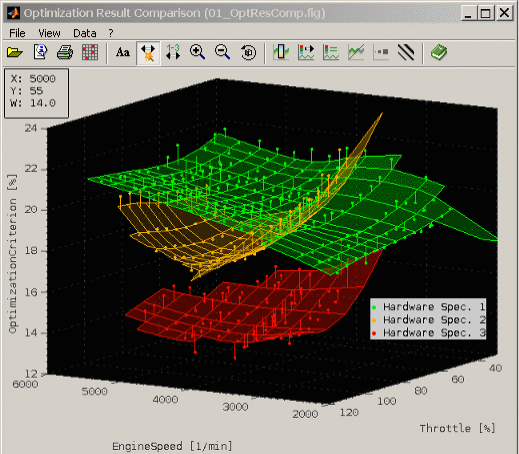
Like the MapArtist it supports the superposition of maps and measurements points. To be able to quickly compare different calibrations and configurations, a "Data Selection" window is available, which allows to switch on and off the elements shown - for example based on criteria like measurement name, dataset, cylinder etc. Any criteria assignable to the data can be used during creation of the figure-files.
Since it is a mere visualization tool, no changes to the data or maps can be made. But e.g. it is possible to copy data to the clipboard and export graphics preconfigured for e-mail or office software. The display can be configured with respect to color, transparency, lines, dots, and light source. Combined with rotate and zoom functionality a quick and transparent evaluation of different calibrations superposed with measurement data is possible.
3.1 View
3.1.1 2D / 3D mode
The figure may contain a 2D or 3D view. This is gives by the figure and cannot be changed. The functionality available and the keyboard shortcuts depend on the mode.
3.1.2 Zoom, pan, rotate, center
The actual view can be adjusted to your needs in multiple ways. Use the keyboard shortcuts or mouse to be fast.
Zoom: Ctrl+ +/-, Mouse wheel
Pan: Ctrl+left/right, Ctrl+up/down, Ctrl+Mouse Wheel, Shift+Mouse Wheel
Rotate: Up/Down, Pageup/Pagedown, Ctrl+Shift+Mouse Wheel
Center: Shift + Mouse
3.1.3 Standard views
When opened the figure presents a initial view. In 3D mode a set of additional views like orthogonal views is available. Together with the initial view they define the standard views.
When calling the function “Reset / Standard views” (Ctrl + r) first the initial view will be displayed. Repeatedly used it will switch through the standard views.
3.1.4 Marked object
You can mark any data object by selecting it with the mouse. If the objects has data information this will be printed as a cursor value in the top left corner.
3.1.5 Axes settings
You can modify the axes ranges of the current view using the corresponding menu item or by double clicking any axes labels. The axes ranges will be reset if switching through standard views (Ctrl + r, Ctrl+ F12). It is also possible to adjust only the view without resetting the axes ranges (Shift + F12, Shift + r).
Check “Axis auto” to keep the axis ranges automatically adjusted to the data items (Ctrl + a). Uncheck to keep the axis ranges fixed (Ctrl + a).
The axes labels are not always visible to maximize the view area if “Maximize axis area” is activated.
3.1.6 Legend
If multiple objects are displayed you can switch on a legend for the actual visible data items (Ctrl + l). The legend will describe the data items.
The legend is made invisible while rotating the 3D view.
3.1.7 Color objects
The color of the data objects can be modified in multiple ways. You can explicitly choose the color (Double click) or let the color to be chosen depending on one of the filter criterion. This can be done in the menu or by double clicking with the right mouse button on the header line of a filter table in the data selection window.
Objects grouped together (as one legend entry) will always share the same color.
The color of the actual chosen data items can also quickly be switched to the next / previous color (Ctrl + n/p).
3.1.8 Light
To emphasize the 3D view a light source and direction can be chosen.
3.1.9 Transparency, Marker, Lines
The marker size, line width and transparency of the objects can be influenced. When “Highlight marked” in the transparency menu is checked the actual marked object is set to a different transparency if it has a surface style. This improves the determination of the marked object.
3.2 Data
3.2.1 Data items visibility
If the figure contains data items you can open an additional window to influence their visibility (Space, Ctrl + d). If the option is checked in the menu the data selection window will automatically hide when moving the mouse from the data selection window to the main figure window as long as both windows overlap. You can also hide it manually (Esc, Ctrl + d).
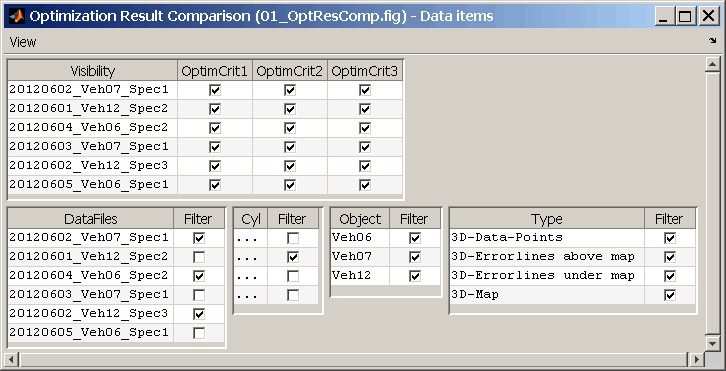
Inside this window you find a main check box table in the top section and possibly one or more filter tables below. You can use the check boxes to switch on/off the visibility of the data items and to apply filter attributes.
In this way you can quickly adjust the view to your needs.
The order of the entries of the tables can be modified (Ctrl+up/down/left/right). The selected rows can be moved up or down for all tables individually and the columns also left or right for the upper main check box table.
By double clicking with the right mouse button on the header line of a filter table or using the context menu you can quickly color all visible objects depending on the filter criterion.
3.2.2 Copy to clipboard / Show data
The data of the actual chosen data items can be copied to clipboard in a format that can be used e.g. in a spreadsheet program (Ctrl + c). The data can also be visualized directly inside the SGE Viewer by showing it in a text window.
3.3 Info
If available a window is opened to display a textual description of the data or additional information that help to interpret the figure content (Ctrl + i).
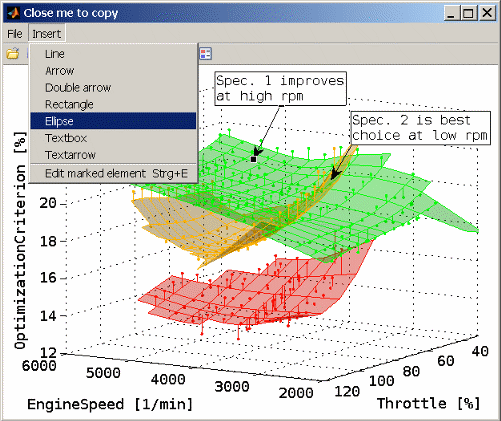
3.4 Present, print data
To be able to use the window contents also for presentation purposes, the SGE Viewer makes it available to export the actual view into the clipboard or file formatted in a way that is suitable to be useful for different targets.
Document
Email
File
Printer
This can be different sizes of clipboard content. "Email" and "Document" are specially sized to fit into a email or document software. "Email" creates a bitmap format while "Document" creates a vector format. Some paper formats are also available and all windows can be printed and saved to file in various formats.
The created window is configurable. So you can move elements like legend or cursor boxes. It is also possible to add lines, arrows, text boxes etc. to the window to explain or highlight.
4 General information
Duplication, processing, distribution or any form of commercialization of the documents content beyond the scope of the copyright law shall require the prior written consent of the SGE Ingenieur GmbH. All trade and product names given in this document may also be legally protected even without special labeling (e.g. as a trademark).
MATLAB Simulink and Stateflow are registered trademarks of The MathWorks Inc., Natick, MA, USA.
The SGE Circus includes Third Party Software. For details please refer to the → SGE Circus documentation.
SGE Ingenieur GmbH – www.sge-ing.de
Copyright 2011-