Welcome to the
SGE Ingenieur GmbH

We are specialists in terms of ECU development for the vehicle and mobility industry.

Back to top

Calibration

Business Activities

  • Calibration of vehicle projects
  • Calibration of functional packages (e.g. load-calculation, torque-model, ignition)
  • Testbench calibration
  • Calibration support for concept- and predevelopment
  • Emission development
  • Country / fuel variants
  • Engine / muffler / airbox variants
  • Analysis of series problems
  • Motorsports calibration
  • Base calibration of research engines

Calibration is the optimization of the parameters of the electronic control unit to achieve the targets regarding road performance, power output, emissions and fuel consumption as efficiently as possible.

Task of the calibration is to guarantee the target achievement reliably at all environmental conditions the vehicles are operated. It has to compensate production tolerances at the manufacturer and the aging behavior at the customer. The effort to ensure a perfect engine running at all the above mentioned variable conditions is considerably bigger than for the calibration of the brand-new vehicle without tolerances at standard environmental conditions.
During the development the calibration department is moreover responsible for making the test vehicles run in a way that the target achievement can be proved early and all corresponding departments have a suitable basis to start their own work. This has to be valid for all construction stages and for all modifications made during development.

An calibration is well done when it achieves the targets reliably and with minimal effort. A good calibration is the key to customer satisfaction and to avoidance of security-relevant defects, updates, product recalls and thus high costs.

The SGE Ingenieur GmbH is a specialist in the field of ECU Calibration. We have done all kinds of calibration, from one- to six-cylinder engines, from simple to torque-balanced drive-by-wire systems, from sports enduros to luxury tourers, from the predevelopment to support of the series production. Combined with comprehensive understanding of the system and the steady striving for efficiency we are able both to carry out the calibration of new vehicles and engines reliably and speedily and to make modifications at subsystems which smoothly integrate into the complete function of the engine management system and the electronic vehicle network. By making a suitable choice of methods and automation support, recurring tasks are dealt with efficiently. A thorough verification provides a reliable avoidance of series problems.

Besides competences and experiences we own all necessary hard- and software to reach the targets reliably. And when something does not yet exist, we start to develop it - like our SGE Circus.

So we are well prepared to to offer calibration services with the same efficiency and quality for all calibration projects. No matter, if on road, off road, on the racetrack, on water or in the air - The SGE Ingenieur GmbH is the competent contact regarding calibration issues.

Back to top

Functional Development

Business Activities

  • Development of new concepts for engine management systems
  • Adaption of existing functions
  • Reviews of software structure to increase software quality
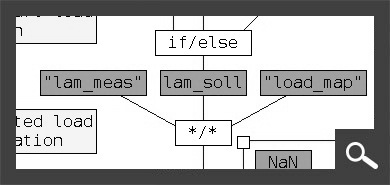
  • Simulink(*) model development for HIL/MIL/SIL testbenches
  • Vehicle residual bus simulation with dSPACE(*) hardware

The quality of a function is put together by on the one hand the possibilities the function itself offers and on the other hand the calibration, which realizes the potential. The very best function will not work well, if its parameters cannot be calibrated in an ideal way, because the available capacity during development is not enough. Otherwise a function which does not provide the necessary possibilities, will not create the desired results even with the most extensive calibration.

Task of the Functional Development Department is to create a software-structure, which fulfills the demands given by the functional requirements and keeps the effort for calibration at a reasonable level. So the reproduction of the physical context and the empiric approach have to be balanced carefully. The physical approach has two main advantages: It can be easily structured understood. The disadvantage of the physical approach is the increasing calibration effort and the risk of having unconsidered side-effects because of the higher complexity of physical systems. In contrast, empiric approaches try to reduce software paths, and make the whole software structure less complex by centralizing and concentrating on the really necessary parts, based on experience. This leads to a reduced calibration effort, but probably also to reduced possibilities of the software functions. All kind of hybrid types between the physical and the empiric approach can be realized. A lot of experience is needed to choose the best concept for every specific application.

Furthermore the Functional Development Department has to see to it that the software structure of the ECU always keeps comprehensible and clear. When add-ons or changes are necessary, they have to be implemented in a way that the calibration engineer is able to estimate and evaluate the impact on other parts of the software structure.

When a smart software function reduces calibration effort or enhances calibration quality, it is especially worth it, because the advantage is multiplying by circular calibration tasks of several projects.

The SGE Ingenieur GmbH is the ideal partner when new functions have to be designed or existing ones have to be adapted. We are experienced both in the fields of calibration and functional development, which enables us to choose the best way between physical and empiric approach to make sure that the function performs as desired, the calibration is only as complex as necessary and the function integrates into the actual software structure.

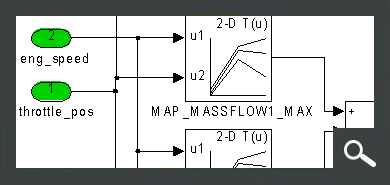
To avoid expensive software changes, new functions are simulated to ensure their functionality.

We naturally offer a perfect documentation to all developed functions, which consists of text and graphics. This enables the calibration engineer to have a quick overview as well as to understand all details of the function. So the documentation provides the basis for an efficient and well done calibration.

(*) MATLAB, Simulink and Stateflow are registered trademarks of The MathWorks Inc., Natick, MA, USA.
(*) dSPACE is a registered trademarks of dSpace GmbH in USA and/or other countries.

Back to top

Automation

Business Activities

  • Development of MATLAB(*) applications to automate measurement analysis and visualization
  • Development of MATLAB(*) applications to automate testbench operation
  • Vehicle residual bus simulation with dSPACE(*) hardware
  • Simulink(*) model development for HIL/MIL/SIL testbenches

Measuring is the basis for ECU-Calibration. The information necessary to do the calibration of the parameters of the Engine Management System are obtained from measurement data. An automation of the calibration is reasonable when circular tasks are done or there are special demands concerning accuracy and repeatability. By automating these kinds of tasks a considerable increase of efficiency can be seen.

Both the measurement and the analysis of measurement data can be automated.

The automation of the measurement is mainly used at engine and roller testbenches. Several systems like testbench control, ECU and emission analysis system are linked and run automatically. With this approach periodic measurements which are necessary to do e.g. the calibration for load-calculation or torque-model can be done more efficiently. An example for a vehicle application of automation is the automated check of the start calibration. Many starts at changing environmental conditions can be made with little effort.

The automation of the measurement data analysis starts when the measurement is finished. The measurement data has to be checked and transformed into a format suitable for the ECU. Maps can be made from measurements, measurements of the torque model can be evaluated or measurements of endurance tests can be analysed automatically. We develop customised solutions for your development fields.

To be able to interpret the results, it is especially important for the user to understand the operating mode of the automation very well and to operate it experienced. Based on our well-founded calibration experience we can create the interface to the user accordingly. This is why all of our automation solutions come with a suitable interface and a high quality documentation.

(*) MATLAB, Simulink and Stateflow are registered trademarks of The MathWorks Inc., Natick, MA, USA.
(*) dSPACE is a registered trademarks of dSpace GmbH in USA and/or other countries.

Back to top

Consulting

Business Activities

  • Definition of ECU concepts
  • Definition of the functional / software structure
  • Methods of calibration
  • Functional reviews
  • Calibration data reviews

The SGE Ingenieur GmbH is the competent contact when consulting is needed in the fields of ECU Calibration and Functional Development. To achieve the best results for the vehicle it is necessary that function and calibration harmonise perfectly. We were able to accumulate a lot of experience with different ECUs, engines and vehicles.

To make sure that the desired results are achieved, development progress has to be assessed on a regular basis. Reviews of functions and calibration assure that goals are accomplished.

We support you to keep test-vehicles and engine benches running during development, to achieve your objectives in time for releases and start of production, to ensure customer satisfaction and high quality at the customer.

Back to top

About us

KnowHow + Experience

We provide expert knowledge in terms of ECU functional development, calibration and combustion development. Supplemented with years of experience we are able to work on complex tasks qualifiedly and to develop new solutions where standard approaches fail - such as System optimization for the automated calibration of entire ECU functions.

MTZ MTZ
International Calibration Conference International Calibration Conference

Efficiency

We attach special importance to generate optimal results from the resources available. The compliance with aims and timetables is natural for us. We react to changes of the boundary conditions flexibly.

In short: We are fast and good.

Solutions

Technology and innovations must work with the customer - and this reliably over all vehicles and environmental conditions with the customer. Even if vehicles, engines and electronic control units are developed on test beds and measuring areas, we always put special attention on the suitability and reliability with the customer.

So that this can be reached, the functions and methods must be so arranged that they are understandable, easily comprehensible and manageable for the developers. And when these methods do not yet exist, we start to develop them - like our SGE Circus.

Quality

Quality is if goals aren't accomplished by chance but during the development the progress is assessed and deviations are recognized on time. Therefore are for us planning, verification and documentation integral parts of the work as engineers.

ISO9001 ISO9001

Responsibility

As a small company, we have learned to master the economic challenges in the environment of large companies. Competence and efficiency are the keys to success. Together with strong partners, we form a network that forms the basis for a wide range of services and products.

We are therefore committed to the standardisation of development and test systems that facilitate the simple exchange of data or methods. In addition, we support the "OXFAM" initiative, which supports small and medium-sized companies in poor countries in building up a sustainable economic existence on their own.

OXFAM OXFAM
ASAM e.V. ASAM e.V.

Back to top

SGE Circus

To be a good calibration engineer you do not necessarily need to perform magic. But it helps a lot.

For this reason we developed a series of tools which broaden the horizon in terms of measurement data analysis, map optimization and model based calibration - the SGE Circus.

Inform and convince yourself:

Back to top

MapArtist

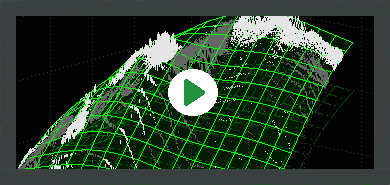
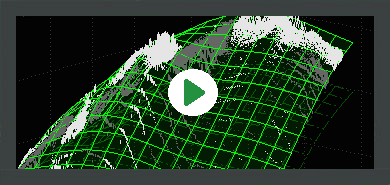
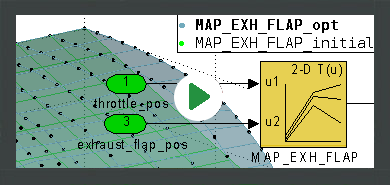
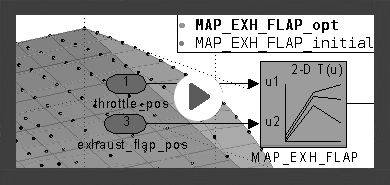
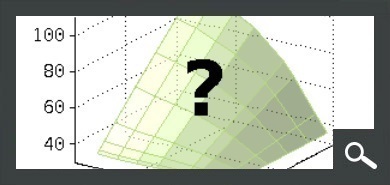
The MapArtist is the star in the ring, when on the fly maps are created from data, displayed and edited.

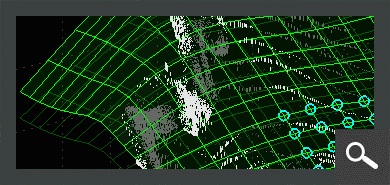
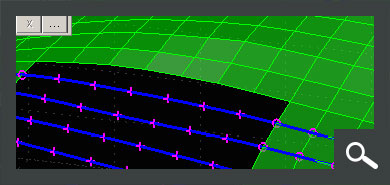
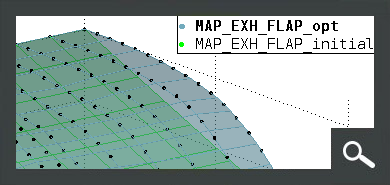
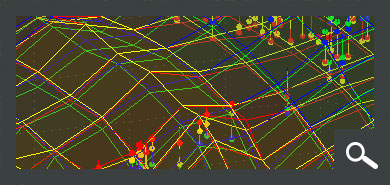
Any number of maps can be imported from various sources. The 2D / 3D and table views allow a customized display. By overlaying the maps with measurement data a clear and accurate assessment of the quality of the application is possible.

Automated algorithms and comfortable manual operation enable efficient optimization and smoothing of maps in consideration of the agreement with the measured data.

Using sessions enables to quickly manage and exchange data evaluations. A graphics export allows to print and present the results.

→ User manual


Data Import Measurement Points

  • Formats MDF3/4, ASCII, IFile, Kistler *.ifi, MATLAB, Excel (*), OpenOffice (*), BLF/ASC-CAN, Diadem, FAMOS, Horiba-VTS, 2D-Logger, Get-Logger, Tellert, Keihin, Magneti Marelli, MoTeC, Audio, Picoscope
  • Data import from MATLAB workspace, function calls, Simulink simulations and DLL output
  • Any number of files can be loaded
  • Down-sampling and time period freely selectable
  • Loaded data can be filtered by any logical expression
  • Definition of any calculated channels including features like map interpolation and Simulink systems integration. By direct use of filters and calculations, the pre-processing of data can often be eliminated.

Data Import Map-Template

  • Sources
    • DCM-, PaCo-, CDFX-Dateien
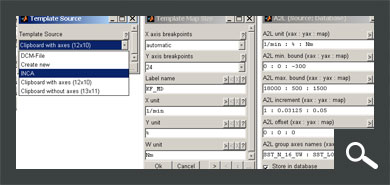
    • INCA (*) via COM-Interface
    • Mectronik MeCal files (*.rbe, *.rbs, *.mke)
    • BMW Race Calibration files (*.bmwrc*)
    • From clipboard with/without axes (e.g. from INCA (*), Excel (*), OpenOffice (*))
    • Creation (incl. automatic axes generation)
    • Import from simultaneously opened MapArtist sessions
  • Consideration of axes groups, units, increments
  • Transposition possible

Map Export

  • DCM-, CDFX-files
  • Direct transfer to ETAS INCA (*) via COM interface
  • Mectronik MeCal files (*.rbe, *.rbs, *.mke)
  • MATLAB script (*.m)
  • Data exchange using cliboard (single points, sections, map with/without axes)

Map Display

  • 3D-Map / Iso-Diagram
    • Display of map, data points, error lines (individually detachable)
    • Colors, transparency, lines, points, light source configurable
    • Rotate, zoom with automatic down-sampling for flowing display even of large amounts of data
  • 2D-Lines
    • Display of 1/3/all map-lines, data points, error lines (individually detachable)
    • Display via x- or y-axis
    • Automatic or manual zoom and Pan
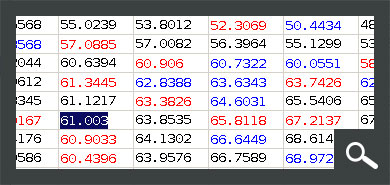
  • Table View
    • Differences working/reference page are displayed in terms of color
    • Data exchange via clipboard
    • Axes can be edited comfortably, since monotony is only checked when the view is exited

Map Creation

  • Automatic map optimization
    • Quick view
    • Map optimization (data mean value, above data, below data)
    • Fit plane, fit polynomial 2nd/3rd order
  • Automatic map smoothing
    • Several smoothing algorithms
    • Definable boundaries for values and error
    • x-/y-direction selectable separately or together
  • Automatic axes optimization
    • Areas definable
    • x-/y-direction selectable separately or together

Map Editing

  • Working / Reference page
  • Increment, decrement, +, -, *, /, %
  • Set to reference page or template value
  • Interpolating, extrapolating
  • Distribute changes

Cursor

  • Displays the current point or current range if multiple points are selected
  • Difference Working / Reference page
  • Absolute / relative error referenced to data points
  • Mark color shows improvement / deterioration during adjustment

Session

  • The whole session including data can be stored.
  • After re-opening the whole functionality can be used again immediately.
  • File size depending on loaded data.

History

  • Undo- / Redo-functionality
  • All dialogs have a history and filters to find former inputs quickly.
  • All dialogs offer export and import functionality to load and document inputs.

Superposition

  • Snapshot-functionality allows 3D-superposition of any number of maps from multiple MapArtist sessions
  • Map comparison with full functionality (zoom, rotate, etc.)

Info

  • Display information about loaded data, data files, time ranges and measurement comments
  • Information about the origin of template and map, size and axes
  • Documentation and validation

Graphic Export

  • Configurable export of the actual screen to the clipboard
  • Ready formatted for email or office software. Reports made easy.
  • Axes, fonts, sizes adjustable. Adding notes, highlights, etc.

(*) MATLAB, Simulink and Stateflow are registered trademarks of The MathWorks Inc., Natick, MA, USA.
(*) Apache OpenOffice or Microsoft Excel must be installed for full functionality. Apache and OpenOffice are registered trademarks of The Apache Software Foundation. Microsoft, Microsoft Windows and Excel are either registered trademarks or trademarks of Microsoft Corporation in the United States and/or other countries.
(*) INCA is a registered trademark of ETAS GmbH, Stuttgart, Deutschland.

Back to top

DataArtist

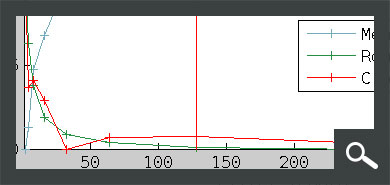
The DataArtist is our magic wand in terms of visualizing and processing measurement data.

Data can be quickly and easily loaded from an arbitrary number of files in different formats and may also be superposed. Numerous options and calculated channels are available. An automatic synchronization of time-based MDF measurement data with crank angle based indicating data is possible.

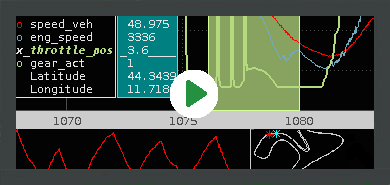
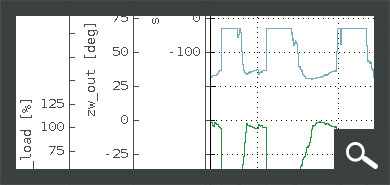
The display is provided via the axis of the loaded data or as xy plot. Through a overview and GPS section, it is easy to orient themselves within the measurement data and to navigate. Cursor enable convenient quick evaluation. The display of the data can be configured with numerous options and is almost completely operatable via keyboard and mouse.

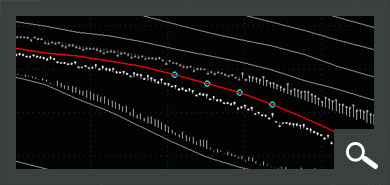
For data analysis constant areas, ramps etc. can be recognized automatically and eg are processed by statistical evaluation. A "Section Optimization" allows to perform sophisticated analysis such as of ignition sweeps.

Using sessions and templates enables to quickly manage and exchange data evaluations. A graphics export allows to print and present the results.

→ User manual


Data Import

  • Formats MDF3/4, ASCII, IFile, Kistler *.ifi, MATLAB, Excel (*), OpenOffice (*), BLF/ASC-CAN, Diadem, FAMOS, Horiba-VTS, 2D-Logger, Get-Logger, Tellert, Keihin, Magneti Marelli, MoTeC, Audio, Picoscope
  • Data import from MATLAB workspace, function calls, Simulink simulations and DLL output
  • Automatic synchronization from IFiles to respective MDF measurements. This enables a parallel evaluation of crank angle based indication measurements, e.g. cylinder pressure traces in time based measurements.
  • Any number of files and FileSets can be loaded and are synchronized automatically.
  • Data preview during file selection
  • Separate / common time pattern, down-sampling, time period
  • Loaded data can be filtered by any logical expression
  • Powerful data / comment preview during file selection
  • Definition of any number of calculated channels including features like map interpolation and Simulink systems integration
  • x/y-plot

Data Export

  • Formats MDF3/4, ASCII, Excel (*), OpenOffice (*), MATLAB(*), Google Maps/Earth (*)
  • Channels, time periods selectable
  • Statistical data

Session

  • The whole session including data can be stored. After re-opening the whole functionality can be used again immediately.
  • File size depending on loaded data

Template

  • The session-configuration can be stored as a template.
  • When the template is loaded, the session is reconstructed
  • Quick swap between prepared standard-configurations
  • Minimum file size
  • LastTemplate allows to reconstruct the last session without previous saving.

History

  • Undo- / Redo-function for display and mark activities
  • All dialogs have a history and filters to find former inputs quickly.
  • All dialogs offer export and import functionality to load and document inputs.

Display Configuration

  • Channels can be displayed as Stairs / Lines / Stems / Marker
  • Channel scaling manual, predefined, automatic, smart range or mouse driven
  • Overview-chart, GPS-overview
  • Automatic down-sampling for visualization of large data volumes
  • Tabs for clear presentation of data

Cursor

  • Any number of Cursors displayable
  • Cursor difference absolute and/or relative
  • Channel order can be sorted or adjusted manually
  • Legend position left or right

Marks

  • Sections can be marked manually or automatically
  • Split: Split of sections in n parts
  • Channel classification: Partition of sections in e.g. constant temperature or engine speed steps
  • Logical detection: Mark of areas by logical conditions
  • Ramp detection: Automatic detection of constant phases, ramp measurements, cost down measurements ect.
  • Import: Mark sections with the help of external data

Section Optimization

  • Automated parameter-optimization graphically guided or fully automated
  • Criteria: Max, Min, Mean, Std
  • Direction: Minimum, Maximum
  • 1- and 2-parameter-optimization
  • Polynomial-, Cubic-, Map fit, Simple selection
  • Evaluation of ignition sweeps, parameter variation of injection angle, camshaft actuator etc.
  • Possibility to check and adjust every section manually

Data Processing

  • Direct access to standard tasks of data processing
    • Moving average
    • Duplicate removal
    • Accumulated sums (relative or absolute)
    • Polynomial fit
    • Exponential fit (e.g. estimation of the terminal value of exhaust gas temperatures)
    • Detrend
  • "Unlimited" possibilities by utilization of calculated channels including features like map interpolation and Simulink systems integration

Measurement Information

  • Display of information about loaded FileSets, files and periods
  • Documentation and Validation
  • Display and Edit measurement comments (MDF3/4, Keihin)

Channel Information

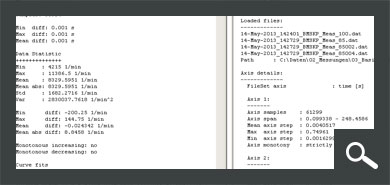
  • Statistic values of the currently visible part of the selected channel and its axis
  • Min, Max, Mean, Std, Curve fits
  • Quick determination of gradients, mean values and standard deviations

Graphic Export

  • Configurable export of the actual screen to the clipboard
  • Ready formatted for email or office software. Reports made easy.
  • Axes, fonts, sizes adjustable. Adding notes, highlights, etc.

Data Exchange

  • Copying selected channel data to clipboard
  • Pasting channel data from the clipboard

(*) MATLAB, Simulink and Stateflow are registered trademarks of The MathWorks Inc., Natick, MA, USA.
(*) Apache OpenOffice or Microsoft Excel must be installed for full functionality. Apache and OpenOffice are registered trademarks of The Apache Software Foundation. Microsoft, Microsoft Windows and Excel are either registered trademarks or trademarks of Microsoft Corporation in the United States and/or other countries.
(*) ©2018 Google LLC All rights reserved. Google is a trademark of Google LLC.

Back to top

ModelArtist

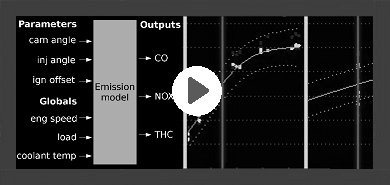
The ModelArtist is a tool to visualize and model multirelational data as well as to enable model based calibration.

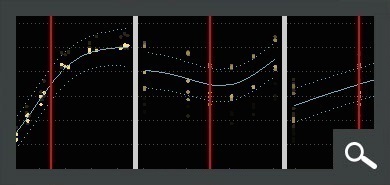
The correlation between an arbitrary number of input / output channels is displayed in a matrix view. Cursors and zoom functionality is used to adjust the display to the relevant data. Thus it is possible to handle relations of high dimensions on the flat screen in a convenient manner.

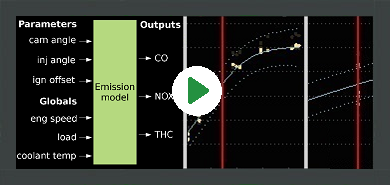
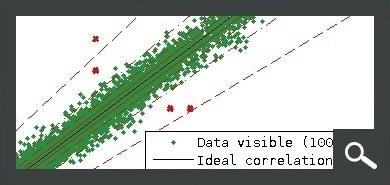
Different kinds of models can be trained to fit the data and enable the homogeneous display of scattered data. Based on the models, on the one hand an optimization of individual engine control parameters can be carried out (e.g. emission reduction) as well as the automatic calibration of entire ECU functions (e.g. exhaust-gas temperature model).

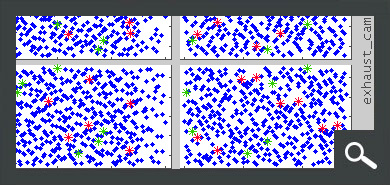
Extensive functions to create statistical test designs are available (DoE).

Using sessions enables to quickly manage and exchange data evaluations. A graphics export allows to print and present the results.

→ User manual


Visualization

  • Data formats MDF3/4, ASCII, IFile, Kistler *.ifi, MATLAB, Excel (*), OpenOffice (*), BLF/ASC-CAN, Diadem, FAMOS, Horiba-VTS, 2D-Logger, Get-Logger, Tellert, Keihin, Magneti Marelli, MoTeC, Audio
  • Data import from MATLAB workspace, function calls, Simulink simulations and DLL output
  • Definition of calculated channels including features like map interpolation and Simulink systems integration. By direct use of filters and calculations, the pre-processing of data can often be eliminated.
  • Automatic down-sampling for flowing display even of large amounts of data
  • Data points, model and confidence display
  • Zoom, cursors
  • Scatter plots based on training/test and model data
  • Data correlations plots to judge inputs relevance
  • Model sections to reduce model dimensions for visualization

Modeling

  • Gaussian, QuickView, Linear, Polynomial, Exponential models
  • Adjustable split of data into training and test data
  • Data clustering to reduce tolerances and speed up model training
  • Training options, accuracy configurable
  • Error plots, outlier removal
  • Correlation plots
  • Pareto plots
  • Input interaction plots
  • Model export / import e.g. for usage in calculated channels or Simulink models

Calibration Parameter Optimization

  • Automatic optimization of calibration parameters (maps, curves)
  • For example emission optimization, closed loop controller calibration, cam timing optimization
  • Calibration parameter source from DCM/PaCo/CDF file or INCA (*) and other file formats
  • Tolerance criterion to enable generation of smooth maps
  • Integration of already existing partial calibration
  • Free definition of the optimization target as taking into account limits, operating point weighting

Calibration System Optimization

  • Automatic calibration of entire ECU functions for mapping a measured model behavior
  • For example exhaust gas temperature model, load detection, torque model
  • Algorithms to achieve smooth plausible results
  • Integration of already existing partial calibration
  • Free definition of the optimization target as taking into account limits, operating point weighting


Design of Experiment (DoE)

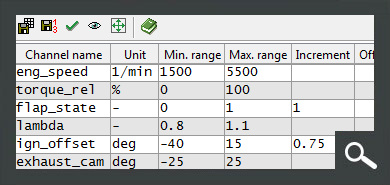
  • Data generation manually, discrete, space-filling (Sobol) - can be combined as desired
  • Free definition of limits in the form of characteristic curves, characteristic maps and higher-dimensional characteristics
  • Integration of test points for drift detection
  • Consideration of incrementation and offset
  • Powerful visualization of the design
  • Export in different formats (MDF3/4, ASCII, MATLAB, Excel (*), OpenOffice (*))

Graphic Export

  • Configurable export of the actual screen to the clipboard
  • Ready formatted for email or office software. Reports made easy.
  • Axes, fonts, sizes adjustable. Adding notes, highlights, etc.

(*) MATLAB, Simulink and Stateflow are registered trademarks of The MathWorks Inc., Natick, MA, USA.
(*) INCA is a registered trademark of ETAS GmbH, Stuttgart, Deutschland.

Back to top

CompareArtist

The SGE CompareArtist is a tool to compare datasets and visualize their differences.

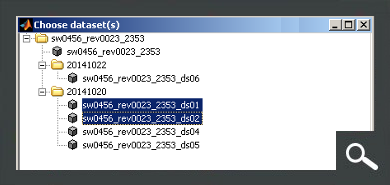
You can load an arbitrary number of datasets and choose the labels to compare. Filters and powerful visualization enables to keep track of calibration progress and dataset variants.

→ User manual


Datasets

  • Dataset sources
    • DCM-, PaCo-, CDFX-files
    • ETAS INCA software
    • Mectronik MeCal files (*.rbe, *.rbs, *.mke)
    • BMW Race Calibration files (*.bmwrc*)
  • Handling of any number of datasets
  • Short name assignment for convenient dataset identification
  • Temporary deactivation of datasets to adjust comparison composition

Labels

  • Various predefined label sets "All master labels", "All labels from all datasets", "All labels from active datasets"
  • Individual label selection with history for quick access to recent settings
  • Read label list from *.lab, *.dcm, *.paco, *.cdfx file and other formats
  • Read from clipboard
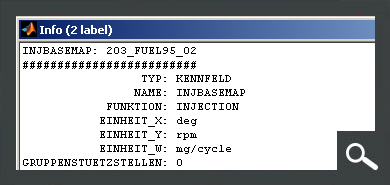
  • Label info enables to access general label information regarding description, axes, ranges...
  • Label highlighting to emphasize and remember label subsets
  • Label renaming to e.g. harmonize naming of multiple ECU labels

Comparison

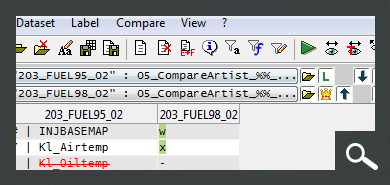
  • Clearly arranged comparison result table with indication ob label type and difference type
  • Filters allow to quickly adjust the result regarding label names, functions, label types, missing labels

Visualization

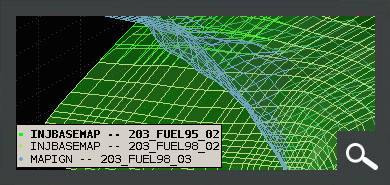
  • Textual and graphical representation of comparison for one or multiple labels
  • "Cross comparison" allows to compare labels with different label names

Transfer

  • Transfer labels between datasets
  • Common axis handling
  • Unequal axis breakpoint number handling
  • Unequal dimension handling

(*) INCA is a registered trademark of ETAS GmbH, Stuttgart, Deutschland.

Back to top

SGE Simulink Library

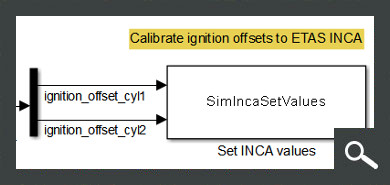
The Simulink Library SGE extends Mathworks Simulink and Stateflow with powerful interfaces and functions that communicate with ETAS INCA software and CAN bus networks.

→ User manual


Features

By combining the extensive functions and intuitive operation of Mathworks Simulink and Stateflow with these interfaces, online functionalities, automation and control tasks that interact with ECUs and CAN bus networks can be implemented conveniently and quickly.

Various ETAS INCA functions are supported, such as:

  • Read measured values and calibration parameters
  • Modify calibration parameters
  • Determination and switching of the ECU active memory page
  • Starting, stopping and pausing data acquisition
  • Activate calibration scenarios

Additionally signals can be received and transmitted in CAN bus networks.

(*) INCA is a registered trademark of ETAS GmbH, Stuttgart, Deutschland. (*) MATLAB, Simulink and Stateflow are registered trademarks of The MathWorks Inc., Natick, MA, USA.

Back to top

SGE Viewer

The SGE Viewer is used by ourselves and our customers to visualize the results of measurement analysis and calibration. We prepare the results as special MATLAB(*) figure files, which can be loaded with the SGE Viewer.

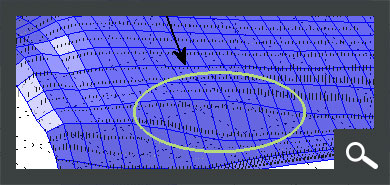
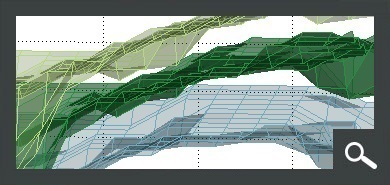
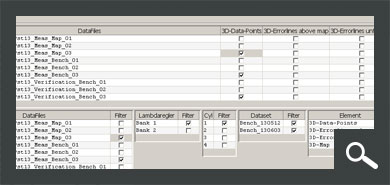
Like the MapArtist it supports the superposition of maps and measurements points. To be able to quickly compare different calibrations and configurations, a "Data Items" window is available, which allows to switch on and off the elements shown - for example based on criteria like measurement name, dataset, cylinder etc. Any criteria assignable to the data can be used during creation of the figure-files.

Since it is a mere visualization tool, no changes to the data or maps can be made. But probably e.g. it is possible to copy data to the clipboard and export graphics preconfigured for e-mail or office software. The display can be configured with respect to color, transparency, lines, dots, and light source. Combined with rotate and zoom functionality a quick and transparent evaluation of different calibrations superposed with measurement data is possible.

The SGE Viewer is developed in MATLAB (*) and is utilized compiled. It is available license free and executable without MATLAB after installation of the freely available MATLAB Compiler Runtime (MCR).

Visualization

  • 3D-Visualization of maps and superposed measurement data
  • 2D-Visualization of time based measurements
  • Rotate, zoom
  • Colors, transparency, lines, points and light source configurable

Data Items Configuration

  • Quick switching on and off of displayable elements
  • Filter criteria and tables allow quick access to relevant data
  • AutoHide functionality

(*) MATLAB, Simulink and Stateflow are registered trademarks of The MathWorks Inc., Natick, MA, USA.

Back to top

OcrArtist

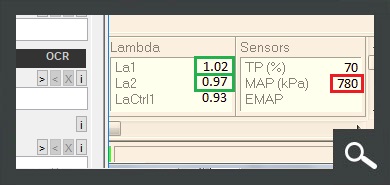
Our software OcrArtist enables to acquire measurement data autonomously without the need for standards or interfaces using OCR (optical character recognition) from the screen.

As a service partner in the field of ECU calibration we work with different ECU-, measurement-, calibration and testbench-systems. For an efficient calibration it is necessary to be able to log all relevant parameters of all involved systems in one file. Standards for interfaces as established e.g. by ASAM are partly not yet implemented in existing systems or the systems are not even designed for.
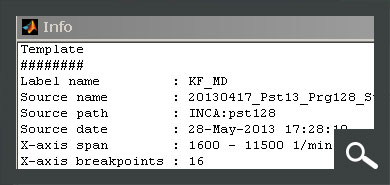
All systems have a interface to humans in common which allows to display measurement values on a screen. This interface is used by our measurement software OcrArtist to capture and record the displayed values by OCR (optical character recognition). OcrArtist enables the user to define and configure measurement channels comfortably. Clippings of any number of program windows can be defined which contain a measurement value. For each measurement value a channel name, channel unit, settings for character recognition and plausibility limits can be set.
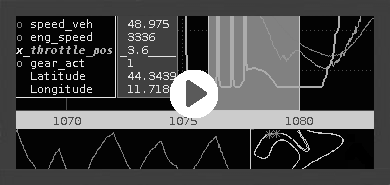
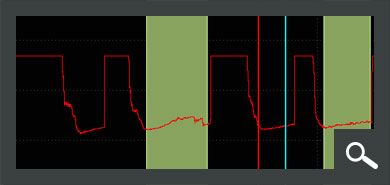
The measurement values can be acquired in different rates. The highest rate depends on CPU power and the number of captured values/windows and is about 10ms. The acquired data can be transmitted by CAN or be stored as a data file which enables the data analysis with popular analysis tools without problems.

In this way values of different measurement systems can be acquired in one file. Via Remote-Desktop values from different computers can be acquired using network connection.

Characteristics

  • Data acquisition from any software using OCR from screen
  • Targets CAN-bus (incl. *.dbc generation), File (*.dat, *.mf4, *.csv, *.xls), socket, SGE DataArtist
  • Acquisition rate 1ms to 60s (depending on CPU-performance)
  • Automatic optimization of recognition parameters
  • Manual extension of recognition possible (database learning)

(*) MATLAB, Simulink and Stateflow are registered trademarks of The MathWorks Inc., Natick, MA, USA.

Back to top

OnlineCalibrationArtist

The OnlineCalibrationArtist supports you calibrating efficiently and using test bench capacity in an optimum way.

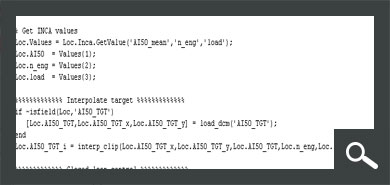
It provides the opportunity run so called routines cyclically. These routines contain commands in MATLAB(*) syntax. The whole functional range of MATLAB is supported. Any number of routines can be configured which can run separate period types. Besides an interface to INCA (*) as well as for CAN-message output and receipt is integrated. The INCA interface allows adjustment, receipt of measurement values, start and stop measurements and switch between working and reference page inter alia. Also the access to measurement values from hardware connected to INCA e.g. indicating system is possible.

In this way it is possible to perform various tasks automated. This can be the main task or in the background to support manual calibration or existing test bench automation system. Depending on ECU connection and computer performance relatively quick controls can be realized - e.g. the cylinder individual control of Lambda and location of center of combustion incl. knock detection (8 controllers) with 30Hz.


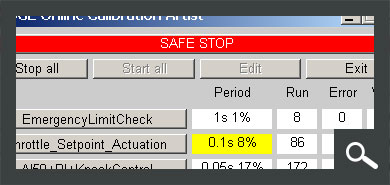
The OnlineCalibrationArtist includes a graphical user interface which allows to start, stop and monitor the routines. Actual run-times and load as well as errors and warnings occurred are displayed and monitored. A SafeStop, which e.g. cuts injection, can be defined as a reaction to warnings and errors and for manual intervention.


Examples of possible routines

  • External AI50- / Knock- / Lambda Control

    The actual operating point like e.g. location of center of combustion, knock criteria or Lambda is read through the INCA interface. The set point is interpolated from a map depending on the actual operating point. The control makes the actual value meet the set point by quick adjustment, of e.g. a ignition angle offset label, in INCA.

    I this way it is possible to make measurements designed to calibrate the load calculation function of an ECU for instance, were the engine is already operated with correct Lambda and location of center of combustion. This permits to calibrate the ignition and torque maps from the very same measurement. A stage-to-stage procedure measurement - load calculation - measurement - ignition - measurement - torque is not necessary any longer.

  • Parameter Screening

    Due to the possibility of measurement and adjustment with INCA, e.g. ignition sweeps or injection angle sweeps can be run fully automated and stored to separate files which can be provided with a name describing the operating point.

    With an up-to-date computer and ETK-ECU ignition sweeps with 30 increments in one second can be performed without problem.

  • Limit Monitoring

    Monitoring that requires complex calculations is easy to implement. Due to the possible use of all MATLAB functionality and syntax, it is possible to interpolate maps, apply filters or implement operating point specific warning times.

(*) MATLAB, Simulink and Stateflow are registered trademarks of The MathWorks Inc., Natick, MA, USA.
(*) INCA is a registered trademark of ETAS GmbH, Stuttgart, Deutschland.

Back to top

PSO

There are several ways to find the optimum calibration of an ECU function. In addition to classic, full factorial screening, more modern DoE methods are applied. If the goal is not to create offline-capable models, but "only" finding the optimum calibration and a possibility to evaluate the quality of the calibration during engine operating exists (e.g. measurement of specific fuel consumption), theoretically any optimization algorithm can be used to search the optimum. This is theoretically a very simple and effective method, which is in practice usually difficult because the problems to be optimized are not linear, have no pre-defined parameter limits and measurements are subject to variations. To such problems often genetic algorithms are applied, but these are quite complex and often must be parametrized consumingly.


The SGE Ingenieur GmbH uses a modified PSO Particle Swarm Optimization algorithm for online optimization. It uses a set of combinations of parameters (particles) which iteratively moves trough the parameter space. Each particle of the swarm starts at a randomly determined or specified start position. Its direction of motion and velocity is influenced both by its own best position of the past (individual), and the current position of the best particle (social). In this way, the swarm moves towards the optimum. Because the PSO algorithm does not use gradient information like other algorithms and parameter combinations can be taken several times, it is particularly suitable for optimization problems that are affected by measurement variations. Moreover, only very few parameters of the algorithm itself need to be tuned, which qualifies it to optimize new or unfamiliar systems.

The PSO algorithm was introduces 1995 by Dr. Eberhart and Dr. Kennedy.

Die SGE Ingenieur GmbH performed some changes and made expansions to make the algorithm suitable for the technical praxis of ECU calibration.


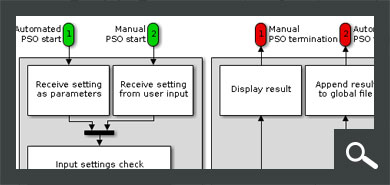
Graphical User Interface

  • Input of necessary information before start of optimization
  • Operation and Monitoring of progress during optimization
  • Manual determination of optimization

Particle Reduction

  • Reduction of particle number with increasing progress to shorten run-time

Sentry Awakening Mechanism

  • Reactivation of particles close to the optimum

Sneak Mechanism

  • Test of trustworthiness of the actual optimum for prohibition of local optima induced by measurement variations close to the global optimum

Expansion of soft Limits

  • Start off with safe, tightly packed limits
  • Automatic expansion and reduction of the limits directed to the global optimum
  • Safe avoidance of engine imperiling parameters

Automation Interface

  • Use of the PSO algorithm in fully automated environment
  • Parametrization and result reply with arguments and results
  • Error and warning handling

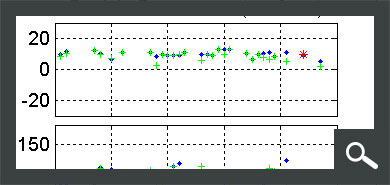
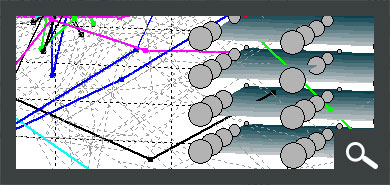
This figure shows a comparison of a factorial measurement to the PSO optimization. The factorial points are displayed as balls. The smaller the better is the result. Therefore the optimum (red circle) is on the border of the measurement section and requires an additional measurement in the neighborhood area.

Additionally the track of the PSO particles is inserted. The colored lines are the particles that came to the end. The grey dotted lines are the particles that were eliminated during the particle number reduction. The quick concentration behavior of the particles is clearly visible. Then especially close to the optimum they cover a lot of parameter combinations because of the sentry awakening mechanism. Therefore they likely get close to the optimum. This behavior is very suitable for technical optimization problems with measurement inaccuracies.

Back to top

SGE Circus Download

Here you can download the installation files that are suitable for you.

After installation, you can instantly discover the features in a restricted mode using examples. The full range of functions is available with some limitations regarding loading and saving of data. A trial license with unlimited functionality can also be requested.

You can choose between an installation file that contains not only the SGE Circus but also the necessary runtime environment (MATLAB Runtime - MCR) and one that gets the runtime environment via download at the time of the installation. In this case, an Internet connection is required at the time of installation. In addition, you can only download the SGE Circus application if the runtime environment is already installed or the portable version is used due to lack of admin rights.

Detailed information about the possible installation variants and how to solve problems can be found in our installation guide.

SGE Circus

64bit architecture

32bit architecture

SGE Simulink Library

Back to top

Reference

Back to top

Contact us

You are interested in our services or products? You would like to receive more information?
Please contact us! We provide you with individual information.

Phone
+49 (0) 8233 794 540 1
Map view
Back to top